


Key highlights India doesn’t need a new conversation about winter air. It needs a stricter one. CPCB’s AQI framework exists precisely to convert complex pollutant data into a number ordinary citizens can understand. The NCAP documentation describes AQI as a communication tool that compresses multiple pollutant readings into a single index value with categories and
Key highlights
- CPCB’s public AQI systems turn multiple pollutant readings into a single index. Prana+1
- AQI categories run from Good (0–50) to Severe (401–500) with listed health impacts. Prana
- The dashboard is data—interpretation still needs restraint.
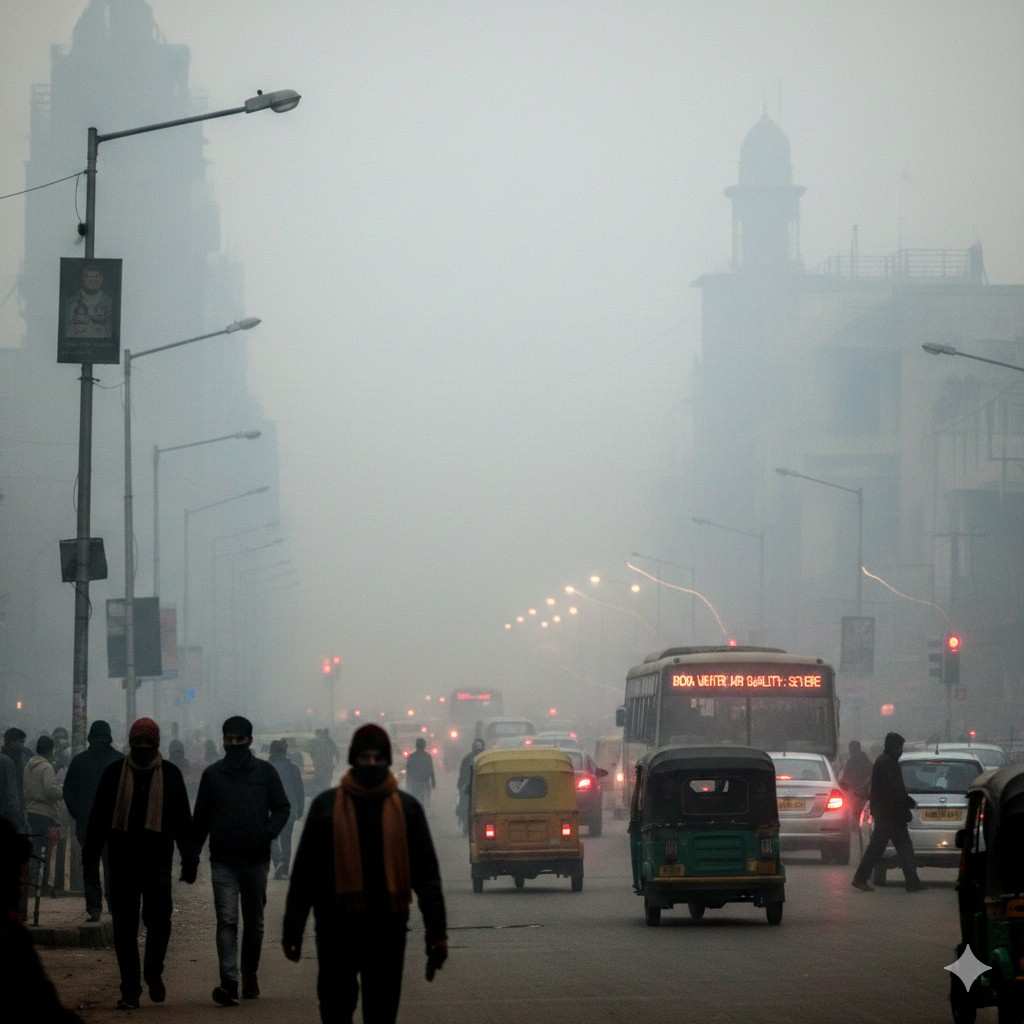
India doesn’t need a new conversation about winter air. It needs a stricter one.
CPCB’s AQI framework exists precisely to convert complex pollutant data into a number ordinary citizens can understand. The NCAP documentation describes AQI as a communication tool that compresses multiple pollutant readings into a single index value with categories and health breakpoints. Prana Those categories are explicit: Good (0–50), Satisfactory (51–100), Moderate (101–200), Poor (201–300), Very Poor (301–400), and Severe (401–500)—each with the kind of health advisory language most people wish didn’t apply to their neighbourhood. Prana
The temptation in early 2026 will be to write air-quality stories like weather stories—dramatic, rapid, reactive. But AQI dashboards deserve a calmer reading. The same official framework explains that AQI is computed across eight pollutants (including PM10, PM2.5, NO2, SO2, CO, O3, NH3, Pb), and the overall AQI is decided by the worst sub-index among them. Prana
That single line—“worst sub-index”—is the editorial guardrail. It means a city’s AQI headline can be pulled sharply upward by one pollutant dominating the day, even if others are comparatively lower. That’s not a flaw. That’s the design: the public message follows the worst exposure signal.
So if you’re writing from the dashboard:
- Don’t treat AQI as a moral score. It’s a risk indicator.
- Don’t ignore the category language. CPCB’s own health impacts are part of the definition. Prana
- Don’t claim medical outcomes from AQI alone—use the official health breakpoint language, not invention.
Winter air coverage in 2026 will either become louder or become smarter. The dashboard already does its job. Now the writing has to.


Leave a Comment
Your email address will not be published. Required fields are marked with *